StephanFX - Forex Trading

Tuesday, August 08, 2006

Forex Trading Systems

A forex trading system is a software platform that allows investors to automatically trade currencies. This allows investors to save time and test very specific strategies.

An investor uses a forex trading system by setting a predetermined event to trigger a specific transaction. For example, a system may be set up to buy 10,000 Euros once Euros hit $1.276 and then sell 10,000 Euros once they hit $1.279. More advanced traders use indicators such as price trends, cycles, momentum and other indicators to attempt to predict which trades will be the most profitable and program their trading platform to execute these trades.

There are many advantages to using forex trading systems. Investors can control their risk by making trades based on the volatility of a currency; safer traders may get out of a currency if its volatility hits a certain level while more aggressive traders are likely to seek out highly volatile currencies to chase the biggest profit. Since everything is computerized, trading strategies can be executed precisely and for long periods of time in a way a human could never do. This lets the investor measure exactly how well the strategy worked without having to worry about human error. Probably the biggest benefit to using a trading system is the fact that it is automated. Traders can be actively trading 24 hours a day without lifting a hand.

Forex trading systems also have some disadvantages. While a mistake with a single transaction may lose some money, a system that is set up wrong could cause hundreds of transactions made by mistake and lose a lot more money. Addiction is another serious disadvantage, forex trading may be an investment to most, but for many it is their way of gambling and addictive. Trading systems provide gambling addicts even more ways to obsess over their addiction. Forex scams are also very prevalent on the internet today. Many companies trick financially ignorant people into giving the company their money in exchange for a once in a lifetime, guaranteed investment opportunity. Basically all of these scams can be avoided by going with the age old rule, if it sounds too good to be true, it probably is.

Forex trading can be fun as well as profitable. However, investors need to fully research the market before jumping in. New investors should start small. Possibly make a few buy/sell, low margin transactions first, and then slowly work up to more risky deals. Creating automatic trading systems is the final step of an experienced forex investor.

-----------------------------
Learn forex trading offers more in-depth information on using forex trading systems. For more on basic stock trading visit Trading Today.
-----------------------------
Monday, August 07, 2006

Forex Trading Education – MACD Indicator (Mac-Dee)

The name MACD is an acronym for Moving Average Convergence Divergence. It was constructed by an analyst in New York by the name of Gerald Appel designed for the analysis of stocks, but is now used widely in all types of markets.

The MACD is an average made up by the difference between two moving averages, which is then plotted as two lines, one being the difference between the two original moving averages and the moving average of the difference, causing one to be slow and one to be fast.

There are a couple of ways to use the MACD, but mostly I personally use it as a divergence confirmation for the RSI and to see if the trend is actually up or down. Another method is to use it as a signal generator, but I will not advocate this because the MACD is a lagging indicator. It can also be seen as an overbought or oversold indicator telling us to start looking for trend reversal.

Divergence:

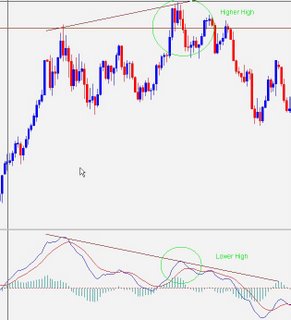
Divergence is noted when the price makes a higher high BUT the MACD makes a lower high, or vice versa for the down trend. Look at the chart below:


Up or Down Trend:

Well, this is kind of obvious, but I thought I should show it anyway. The MACD is in an uptrend when the fast line is above the slower line. Please note that this is not the definitive method of trend determination but only a trend confirmation. For instance, if the trend is predominantly up then you should not trade if the MACD is in sell, but look only for buying opportunities when the MACD is in buy again. This has saved me a couple of times when a trade looked rock solid but my MACD was saying something else.


Overbought and Oversold:

This is also a nice little thing to spot as this means the market MIGHT soon think about reversing. You determine an overbought-oversold situation by looking at the distance between the two lines. The further apart the lines, the more so the overbought or oversold situation is. When the MACD is overbought, you can sometimes see reversal patterns, like in the chart below, we can see tweezer top in the overbought situation and a tweezer bottom in the oversold situation.


Like I said previously, some people use it as a signal generator, but personally I find it works better for me when I used it for divergence confirmation to the RSI.

That is it for this short explanation of the MACD, hoped you liked it, if you would like to know more, drop me a comment.

Trade Well, Live Prosper.