Forex Trading Eduction – The RSI ( Relative Strength Indicator)
Today in my forex trading lesson, I would like to talk about the RSI (Relative Strength Indicator), but more so about how you can use it in your trading arsenal.
Me personally, I like the RSI because I use it for one thing and that is trend reversal. This is one of the most powerful indicators for trend reversal in my opinion, though it can make mistakes. The way to see a trend reversal in the RSI is in the DIVERGENCE between the price and the RSI, meaning that the price made a higher high (in an up trend) BUT the RSI made a lower high, classic divergence. This strategy is more powerful alongside a MACD, when the MACD also shows divergence along with the RSI. In the image below, taken 02 Aug 2006 5min chart, you can see what I mean:
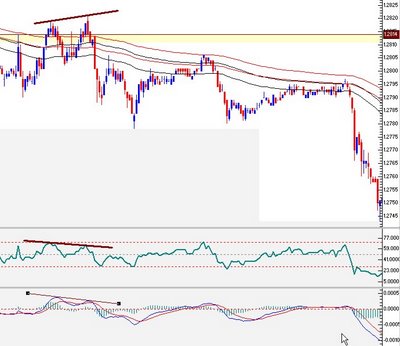
Notice that both the macd and rsi are in divergence with the price and then continues to drop a nice 60 pips. In using my trading method I would have made about 40 pips before exiting.
Well, this is a short and sweet explanation of the RSI and it is not nearly complete but it is here to get you started with something.
Trade Well, Live Prosper.
Me personally, I like the RSI because I use it for one thing and that is trend reversal. This is one of the most powerful indicators for trend reversal in my opinion, though it can make mistakes. The way to see a trend reversal in the RSI is in the DIVERGENCE between the price and the RSI, meaning that the price made a higher high (in an up trend) BUT the RSI made a lower high, classic divergence. This strategy is more powerful alongside a MACD, when the MACD also shows divergence along with the RSI. In the image below, taken 02 Aug 2006 5min chart, you can see what I mean:
Notice that both the macd and rsi are in divergence with the price and then continues to drop a nice 60 pips. In using my trading method I would have made about 40 pips before exiting.
Well, this is a short and sweet explanation of the RSI and it is not nearly complete but it is here to get you started with something.
Trade Well, Live Prosper.
posted by Unknown at
3:39 PM
![]()
![]()


0 Comments:
Post a Comment
<< Home